
import matplotlib.pyplot as plt

# ASCII Control Characters (0-31, 127)
control_ascii = [
    (0, "NUL", "Null"), (1, "SOH", "Start of Header"), (2, "STX", "Start of Text"),
    (3, "ETX", "End of Text"), (4, "EOT", "End of Transmission"), (5, "ENQ", "Enquiry"),
    (6, "ACK", "Acknowledge"), (7, "BEL", "Bell"), (8, "BS", "Backspace"),
    (9, "TAB", "Horizontal Tab"), (10, "LF", "Line Feed"), (11, "VT", "Vertical Tab"),
    (12, "FF", "Form Feed"), (13, "CR", "Carriage Return"), (14, "SO", "Shift Out"),
    (15, "SI", "Shift In"), (16, "DLE", "Data Link Escape"), (17, "DC1", "Device Control 1"),
    (18, "DC2", "Device Control 2"), (19, "DC3", "Device Control 3"), (20, "DC4", "Device Control 4"),
    (21, "NAK", "Negative Acknowledge"), (22, "SYN", "Synchronous Idle"), (23, "ETB", "End of Transmission Block"),
    (24, "CAN", "Cancel"), (25, "EM", "End of Medium"), (26, "SUB", "Substitute"),
    (27, "ESC", "Escape"), (28, "FS", "File Separator"), (29, "GS", "Group Separator"),
    (30, "RS", "Record Separator"), (31, "US", "Unit Separator"), (127, "DEL", "Delete")
]

# Printable ASCII Characters (32–126)
printable_ascii = [(i, chr(i), f"U+{i:04X}") for i in range(32, 127)]

# Extended ASCII (128–255)
extended_ascii = [(i, chr(i), f"U+{i:04X}") for i in range(128, 256)]

# Combine all ASCII (0–255)
all_ascii = control_ascii[:-1] + printable_ascii + [control_ascii[-1]] + extended_ascii

# Category determination
def get_category(code, sym):
    if code <= 31 or code == 127:
        return "Control"
    elif 65 <= code <= 90 or 97 <= code <= 122:
        return "Letter"
    elif (33 <= code <= 47) or (58 <= code <= 64) or (91 <= code <= 96) or (123 <= code <= 126):
        return "Symbol"
    elif code >= 128:
        return "Extended"
    elif 32 <= code <= 126:
        return "Printable"
    else:
        return "Other"

# Colors
category_colors = {
    "Control": "#D3D3D3",   # Grey
    "Printable": "#ADD8E6", # Light blue
    "Extended": "#D8BFD8",  # Thistle / purple
    "Symbol": "#FFD700",    # Gold
    "Letter": "#98FB98",    # Pale green
    "Other": "#FFFFFF"
}

# Grid layout
cols = 16
rows = (len(all_ascii) // cols) + 1

fig, ax = plt.subplots(figsize=(26, 18))

for idx, entry in enumerate(all_ascii):
    row = idx // cols
    col = idx % cols
    code = entry[0]
    sym = entry[1]
    desc = entry[2] if len(entry) > 2 else ""
    cat = get_category(code, sym)
    color = category_colors[cat]

    ax.add_patch(plt.Rectangle((col, -row), 1, -1, facecolor=color, alpha=0.8, edgecolor="black"))
    ax.text(col + 0.5, -row - 0.25, f"{code}", ha="center", va="center", fontsize=8, fontweight="bold")

    if cat == "Control":
        ax.text(col + 0.5, -row - 0.55, sym, ha="center", va="center", fontsize=7, fontweight="bold", color="blue")
        ax.text(col + 0.5, -row - 0.85, desc, ha="center", va="center", fontsize=5)
    else:
        ax.text(col + 0.5, -row - 0.55, sym, ha="center", va="center", fontsize=9, fontweight="bold")
        ax.text(col + 0.5, -row - 0.85, desc, ha="center", va="center", fontsize=5)

ax.set_xlim(0, cols)
ax.set_ylim(-rows, 1)
ax.axis("off")
plt.title("Codex-Style Full ASCII Table (0–255) with Categories", fontsize=20, fontweight="bold")
plt.show()
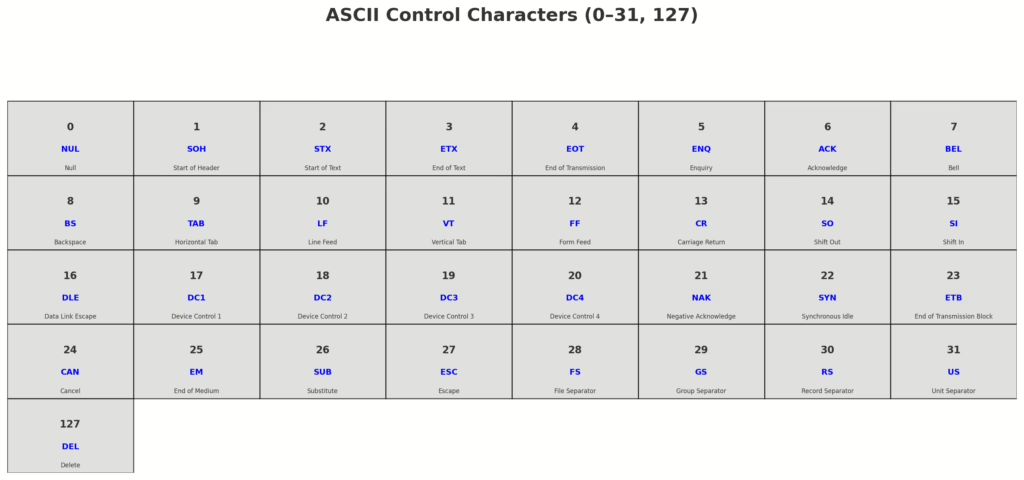

Here’s the Codex-Style Full ASCII Table (0–255), now color-coded by category:
- Grey= Control characters (steering signals, formatting).
- Light Blue= Printable (visible characters, base set).
- Green= Letters (A–Z, a–z, the alphabet itself).
- Gold= Symbols (punctuation, operators, marks).
- Purple= Extended ASCII (accented letters, box-drawing, extra symbols).
Would you like me to now expand each category’s explanation into Codex entries (e.g., Control as invisible law, Symbols as compressed words, Extended as cultural adaptation) so the table has a written companion guide like a glossary?
Key terms in plain language
Open a term for a concise explanation of language used on this page.
Broadband
A general term for always-on, high-speed Internet access. Broadband can be delivered over fiber, cable, DSL, fixed wireless, cellular, or satellite networks.
Cloud Computing
Computing resources—such as applications, servers, storage, or databases—delivered from remote infrastructure and scaled as requirements change.
Cybersecurity
The practices and controls used to protect identities, devices, networks, applications, and data from unauthorized access, disruption, or manipulation.
Identity and Access Management (IAM)
The systems and policies that determine who a user is, what resources they may access, and how that access is authenticated and reviewed.
API
An application programming interface is a defined way for software systems to exchange data or request functions from one another.
Artificial Intelligence (AI)
Software designed to perform tasks involving prediction, classification, generation, reasoning, or decision support. Business use still requires clear data, governance, security, and human accountability.